We are in a period when Jupiter is transiting in Virgo, Saturn in Sagittarius and Neptune in Pisces and with a T-square aspect pattern between those planets including 90 and 180 degree aspects between. This T-square pattern between the mutable signs signifies major economic and financial problems!
What is T-Square Aspect Pattern?
Carrying a high potential, aspect patterns are formed of two or more aspects which triggers each other and function as a whole. Negative aspect patterns challenges certain areas of our lives at the same time. T-square aspect pattern is one of those negative patterns which consists two squares and one opposition. A third planet makes squares with both of planets that are in opposition. So, we may say that the stress generated by the square is doubled. Adding the stress formed by the opposition, it is not hard to say how big the tension will be.
T-squares represent frustration and the efforts to overcome those effects. This harsh aspect pattern contains a huge energy in itself. Whereas it represents many difficulties, it also gives the necessary determination to find the solutions to the difficulties and helps us to achieve significant progress if we are able to manage this energy efficiently. In T-square aspect pattern, there is a target to reach. The energy will not be at ease if this target is not reached; dissatisfaction and disappointment is will be the result. The focal point of this target is called the Apex; it is the point that the third planet squares with the two planets in each end of the opposition. This focal planet functions as the manifestation of the opposition and the nature of this planet signifies the target that needs to be achieved.
Saturn, transiting in Sagittarius, is the planet on the apex of the T-square that will be active by the spring months of 2016. As the planet of restriction and limitation, does Saturn represent some limitation of pessimism in the matters of Sagittarius like international relations and markets? I think the answer should be “Yes” because we know that American economy was faced with constraints and depression during two of the last three Saturn transits in Sagittarius.
Saturn Transits in Sagittarius and Economic Crisis
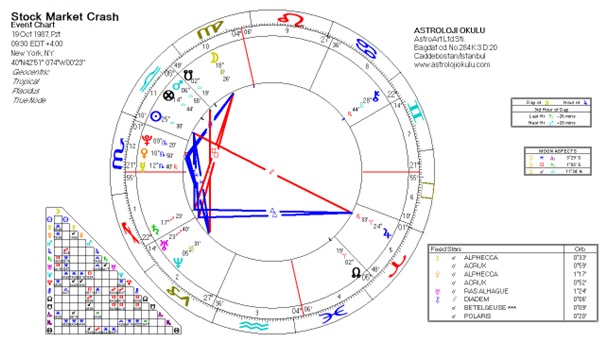
The history witnessed some major economic crisis during Saturn transits in Sagittarius. For example, due to the Wall Street crash on October 19th, 1987 which is also known as Black Monday, Dow Jones Industrial Average fell 508 points (22,6%) – the highest daily crash in stock markets. Many people who trade in stock markets lost all their investments. The crash which began in Hong Kong spread to Asian, European and American markets. New Zealand, Australia, Canada, Hong Kong and Britain stock markets crashed until the end of October. Below you may see the chart of that date. Here you see Saturn in 17 degrees Sagittarius is forming an opposition with Chiron and conjunction with Uranus.
.jpg)
In mundane astrology first we identify the planetary positions of the major events and then follow the transits that trigger those positions. Major planetary transits, especially Saturn’s backwards movement to its position at the time of the event, other planetary positions and the geometric aspects between the planets in the event chart are considered. If the aspects are stressed ones, it is concluded that the events similar to that one may take place or the energies effective during the event could again be triggered.
Now we see that following this approximately 30 year period (a Saturn cycle), Saturn is about to reach the same position that it was during the Black Monday. So, comparing other planetary positions at the date of full cycle with the Black Monday chart could give us some insight.
In the above diagram, you see the comparison of two charts; one is the chart of October 19th, 1987 and the other is the chart for the date November 27th, 2016 when Saturn return is completed. At the time of Saturn return, we see that there is a T-square aspect pattern between Jupiter, Uranus and Neptune which suppresses Sun-Jupiter opposition in Black Monday’s chart. There are many aspects between these two charts like opposition, square and conjunction however the focus on T-square may alone be a signification of some stress in the economics.
_1.jpg)
The greatest market crash which is known as Great Depression or Black Thursday took place on October 24th, 1929. We see Saturn is at the 26th degree of Sagittarius in the chart of that day.
_1.jpg)
There are many things to talk about this chart however now let’s focus on Saturn only and have a look at one of the dates in our times that Saturn will reach the same position again. In the chart of February 23rd, 2017 when Saturn will be at the same degree as it was on Black Thursday (the outer wheel in Figure 4), we see that Mars-Uranus conjunction is in opposition with Jupiter and this T-square creates a stress on Moon-Pluton conjunction of Black Thursday chart. Transiting Pluton is in opposition with its position in Black Thursday chart. Jupiter-Uranus opposition which creates a long term influence is also close to the MC/IC axis of Black Thursday chart.
_1.jpg)
Similar comparisons may be made with other charts of course. In those samples, our reference was Saturn’s position in Sagittarius. We do not claim that again a great depression will take place in that exact date however those charts signify that major difficulties will be experienced in stock markets around the Saturn return periods. Accordingly, we may be faced with some difficulties in economics by November 2016 and February 2017.
Saturn transits in Sagittarius coincide with major events in USA’s history as USA’s Ascendant is Sagittarius. When we observe last three Saturn transits, we see that all of them represent hard times in economics. Two of them coincide with capital market collapses.
.jpg)
To be continue…

